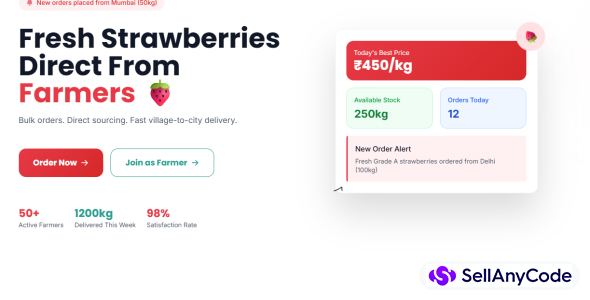
Secure Remote Guardian Shield
Real Time Network Monitoring Tool - Sever Management And AI Security Platform
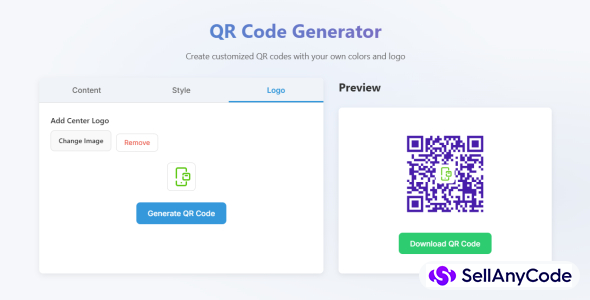
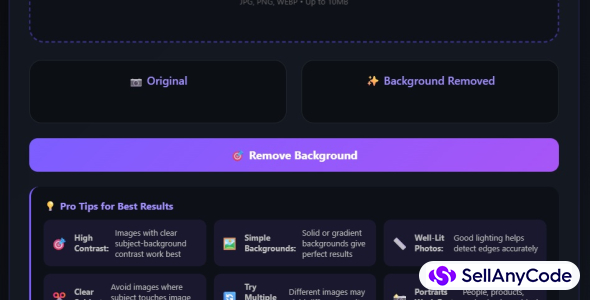
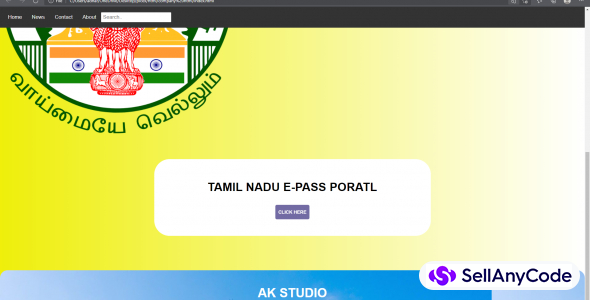
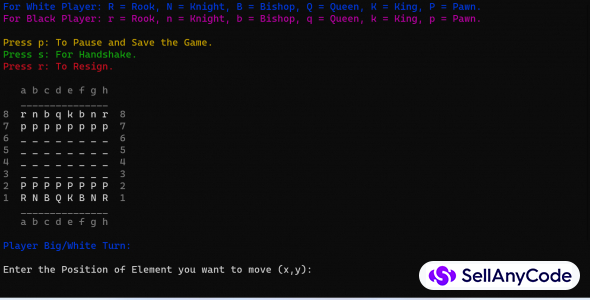
Screenshots
Item Description
Features
SecureRAT Enterprise Tool
Complete Feature Documentation
Generated: 9/14/2025, 11:55:59 AM
TABLE OF CONTENTS
1. Navigation Structure and Sidebar Menus
2. Dashboard Overview and Statistics
3. Server Management System
4. Secure Terminal Access
5. Infrastructure Reports
6. Security Requirements Automation (SecureRAT)
7. Email Alert System
8. Settings and Configuration
9. Monitoring Systems
10. Network Management
11. Application Monitoring
12. Interactive Elements Summary
1. NAVIGATION STRUCTURE AND SIDEBAR MENUS
The main navigation sidebar provides access to all system features:
• OVERVIEW (Dashboard Icon)
- Main dashboard view with real-time statistics
- Live system monitoring cards
- Performance metrics and alerts
• SERVER MANAGEMENT (Server Icon) - Badge: 4 servers
- Server monitoring and control
- Performance metrics tracking
- Server configuration and management
• SECURE TERMINAL (Terminal Icon) - Badge: SSH
- Remote terminal access
- Multi-device connection support
- Command execution and monitoring
- ADD DEVICE button for adding new remote devices
• INFRASTRUCTURE REPORTS (File Icon)
- System performance reports
- Security assessment reports
- PDF brochure generation
• EMAIL ALERTS (Mail Icon) - Badge: 3 critical alerts
- Alert configuration and management
- Notification settings
- Alert history and analytics
• SECURITY (SecureRAT) (Shield Icon) - Badge: NEW
- Requirements Manager
- Vulnerability Scanner with RUN FULL AUDIT button
- Compliance Tracker
- Risk Assessment
- GENERATE REPORTS button for audit reports
• SETTINGS (Settings Icon)
- Account configuration
- System preferences
- Security settings
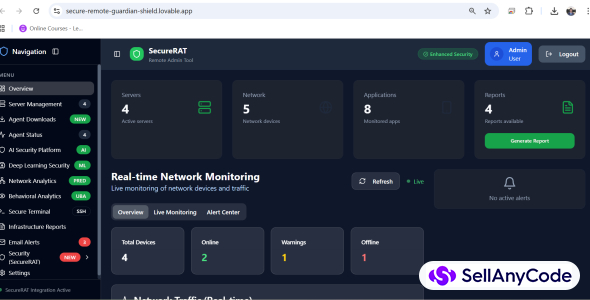
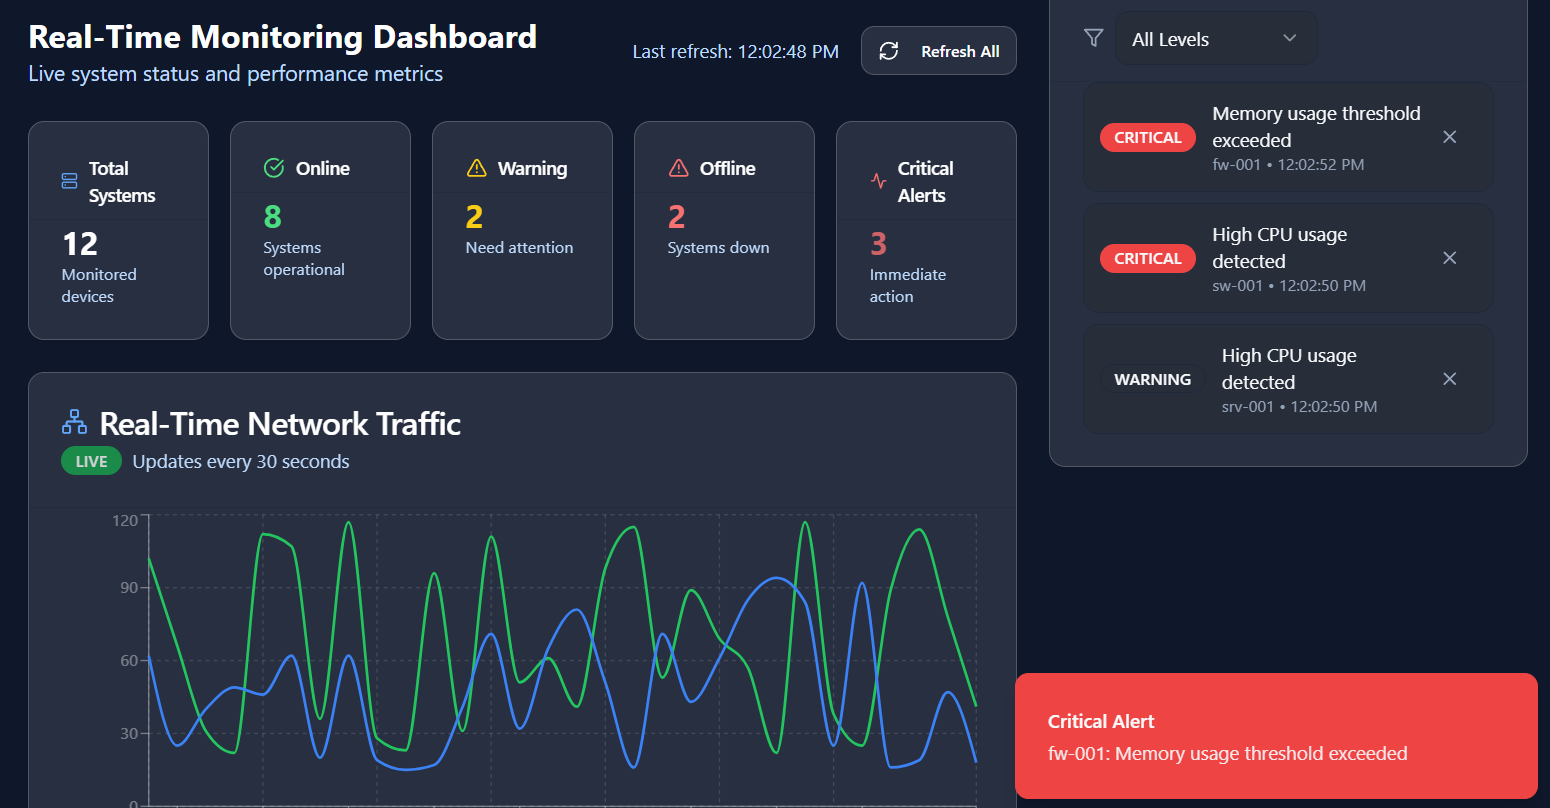
2. DASHBOARD OVERVIEW AND STATISTICS
The main dashboard provides comprehensive system overview:
STATISTICS CARDS:
• Server Count: 4 active servers
• Network Count: 5 network devices
• Application Count: 8 monitored applications
• Website Count: 3 monitored websites
REAL-TIME MONITORING:
• Live system metrics with auto-refresh capability
• Performance graphs and interactive charts
• Real-time alerts panel with severity indicators
• System health indicators with color-coded status
• Network status monitoring with latency tracking
INTERACTIVE ELEMENTS:
• Real-Time Toggle Switch for live monitoring
• Run Health Check Button for system diagnostics
• Quick Actions Dropdown menu
• VIEW DETAILS buttons on each system card
• LAST HOUR SETTINGS button for time-based monitoring
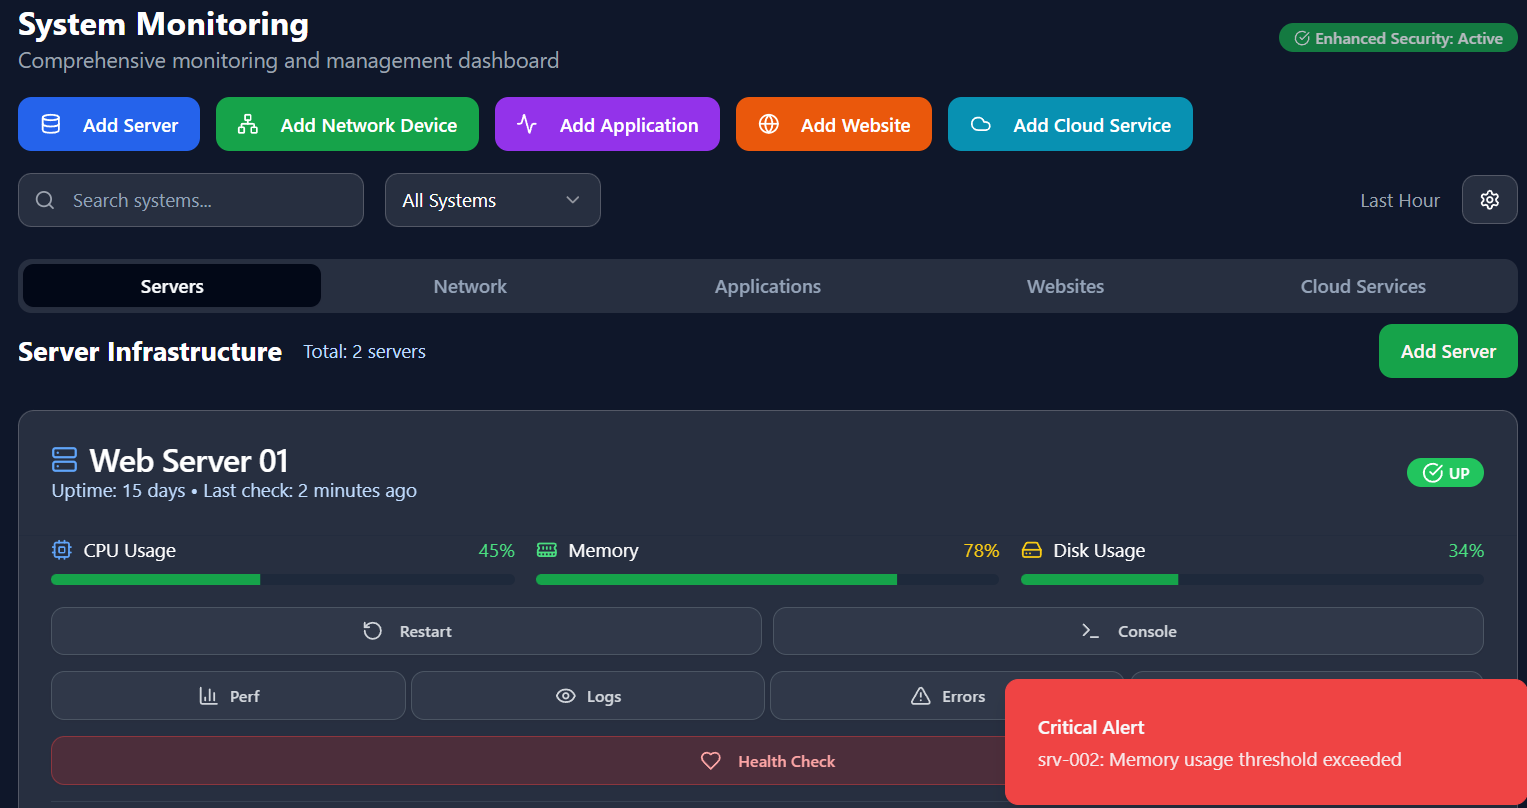
3. SERVER MANAGEMENT SYSTEM
Comprehensive server monitoring and management interface:
SERVER MONITORING FEATURES:
• Real-time server status indicators (Online/Warning/Offline)
• CPU, Memory, and Disk usage meters
• Uptime tracking with historical data
• Last check timestamps for each server
• Process monitoring and service status
SERVER ACTIONS:
• Restart Server button for remote restart
• Run Diagnostics for system health checks
• View Logs for troubleshooting
• Configure Alerts for threshold settings
• SSH Connect for direct terminal access
SERVER MANAGEMENT:
• Add Server functionality with configuration wizard
• Automatic server discovery
• Connection testing and validation
• Performance baseline establishment
4. SECURE TERMINAL ACCESS
Enhanced remote terminal with multi-device support:
TERMINAL INTERFACE:
• Multi-tab support for concurrent sessions
• Command history and auto-completion
• Syntax highlighting for better readability
• File transfer capabilities
• Session recording for audit purposes
DEVICE MANAGEMENT:
• ADD DEVICE button (ENABLED) for adding new remote devices
• Connected devices panel with status indicators
• Quick connect buttons for rapid access
• Device type indicators (Server/Router/Switch)
• Last activity timestamps
ADD DEVICE MODAL:
• Device name input field
• IP address/hostname configuration
• Port configuration options
• Authentication method selection
• Test Connection button for validation
• Add Device and Cancel buttons
SECURITY FEATURES:
• SSH key management
• Two-factor authentication support
• Command auditing and logging
• Access control lists
5. INFRASTRUCTURE REPORTS
Comprehensive reporting system with multiple formats:
REPORT GENERATION TABS:
• Generate Reports tab with progress indicators
• PDF Brochure tab for complete documentation
• Report History tab with status tracking
• Analytics tab for trend analysis
REPORT TYPES:
• System Performance Reports
• Security Assessment Reports
• Compliance Reports
• Custom report builder
EXPORT FORMATS:
• PDF export with professional formatting
• Excel spreadsheets for data analysis
• CSV data export for integration
• HTML reports for web viewing
SCHEDULING OPTIONS:
• Daily automated reports
• Weekly summary generation
• Monthly analysis reports
• Custom interval configuration
6. SECURITY REQUIREMENTS AUTOMATION (SECURERAT)
Advanced security management and compliance system:
SECURITY AUDIT SYSTEM:
• RUN FULL AUDIT button (ENABLED) for comprehensive security scanning
• Real-time audit progress with detailed status updates
• Test categories: Authentication, Network Security, Data Protection
• Severity levels: Critical, High, Medium, Low
• Compliance score display with radar charts
AUDIT REPORTS:
• GENERATE REPORTS button (ENABLED) for audit documentation
• Comprehensive security audit reports
• Automatic report download functionality
• Report contents include compliance scores and recommendations
SECURITY FEATURES:
• Requirements matrix with compliance tracking
• Vulnerability assessment and scoring
• Risk assessment with threat modeling
• Policy validation and gap analysis
• Remediation recommendations
• Audit trail generation
SCHEDULING:
• Daily security scans
• Weekly vulnerability assessments
• Monthly compliance audits
• Custom scheduling options
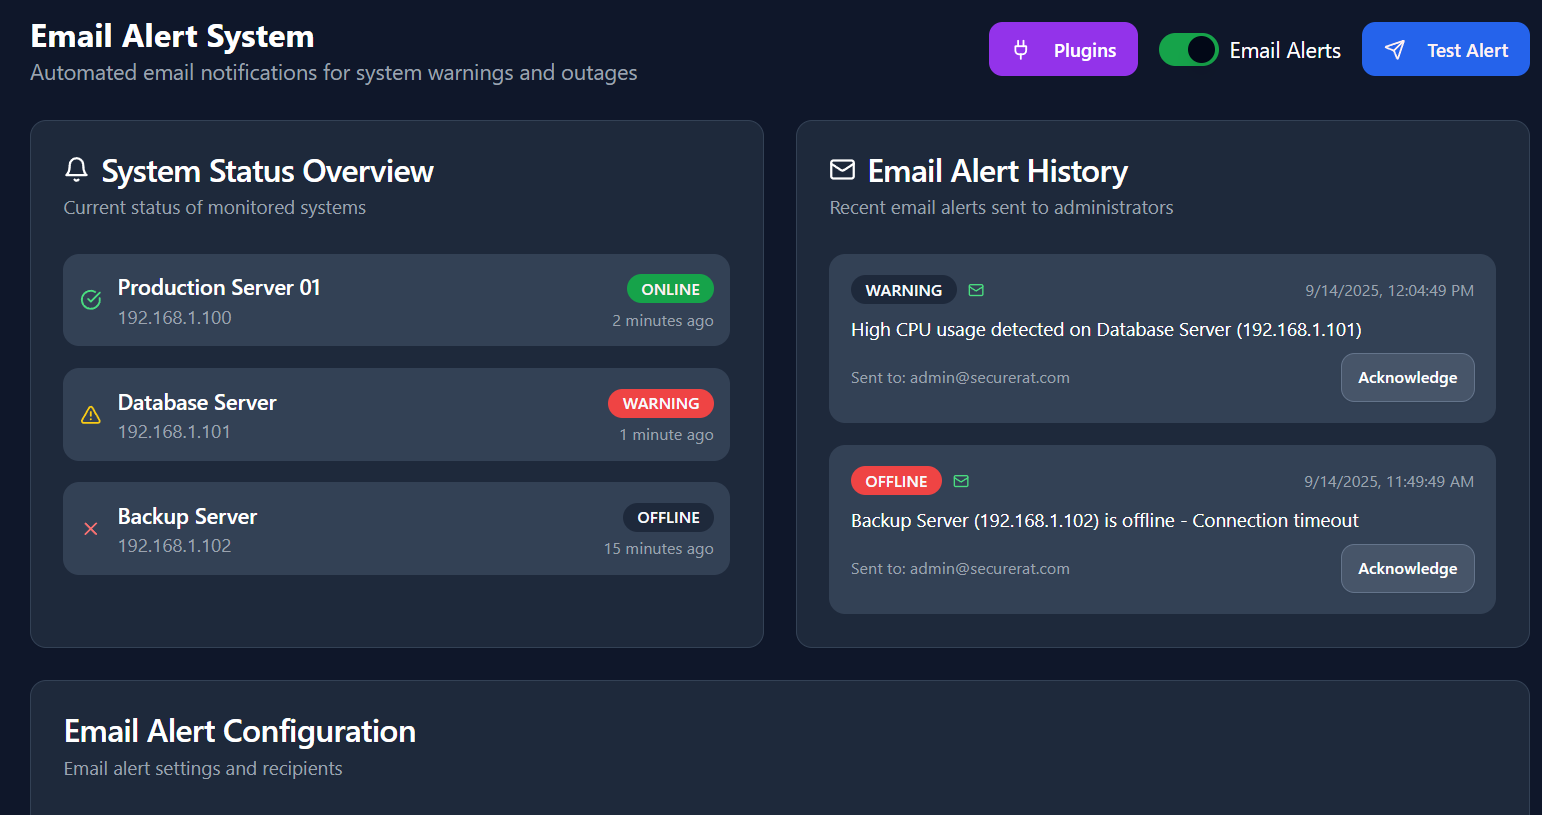
7. EMAIL ALERT SYSTEM
Comprehensive alert management and notification system:
ALERT MANAGEMENT:
• Real-time alert generation with severity classification
• Email notification system with customizable templates
• SMS alert integration for critical events
• Webhook notifications for third-party systems
ALERT CONFIGURATION:
• Threshold settings for various metrics
• Escalation rules with time-based triggers
• Multiple notification channels
• Alert suppression during maintenance
ALERT HISTORY:
• Historical alert tracking with search capabilities
• Alert analytics and trend analysis
• Response time metrics
• Resolution tracking and reporting
8. SETTINGS AND CONFIGURATION
Comprehensive system configuration interface:
ACCOUNT SETTINGS:
• User profile management
• Password configuration and policies
• Two-factor authentication setup
• Session management and timeout settings
CONNECTION SETTINGS:
• Network configuration parameters
• SSL/TLS certificate management
• Proxy configuration for corporate networks
• Connection timeout and retry settings
NOTIFICATION SETTINGS:
• Email server configuration
• SMS gateway settings
• Webhook endpoint management
• Alert preference customization
SECURITY SETTINGS:
• Role-based access control
• Audit logging configuration
• Encryption settings and key management
• Compliance configuration options
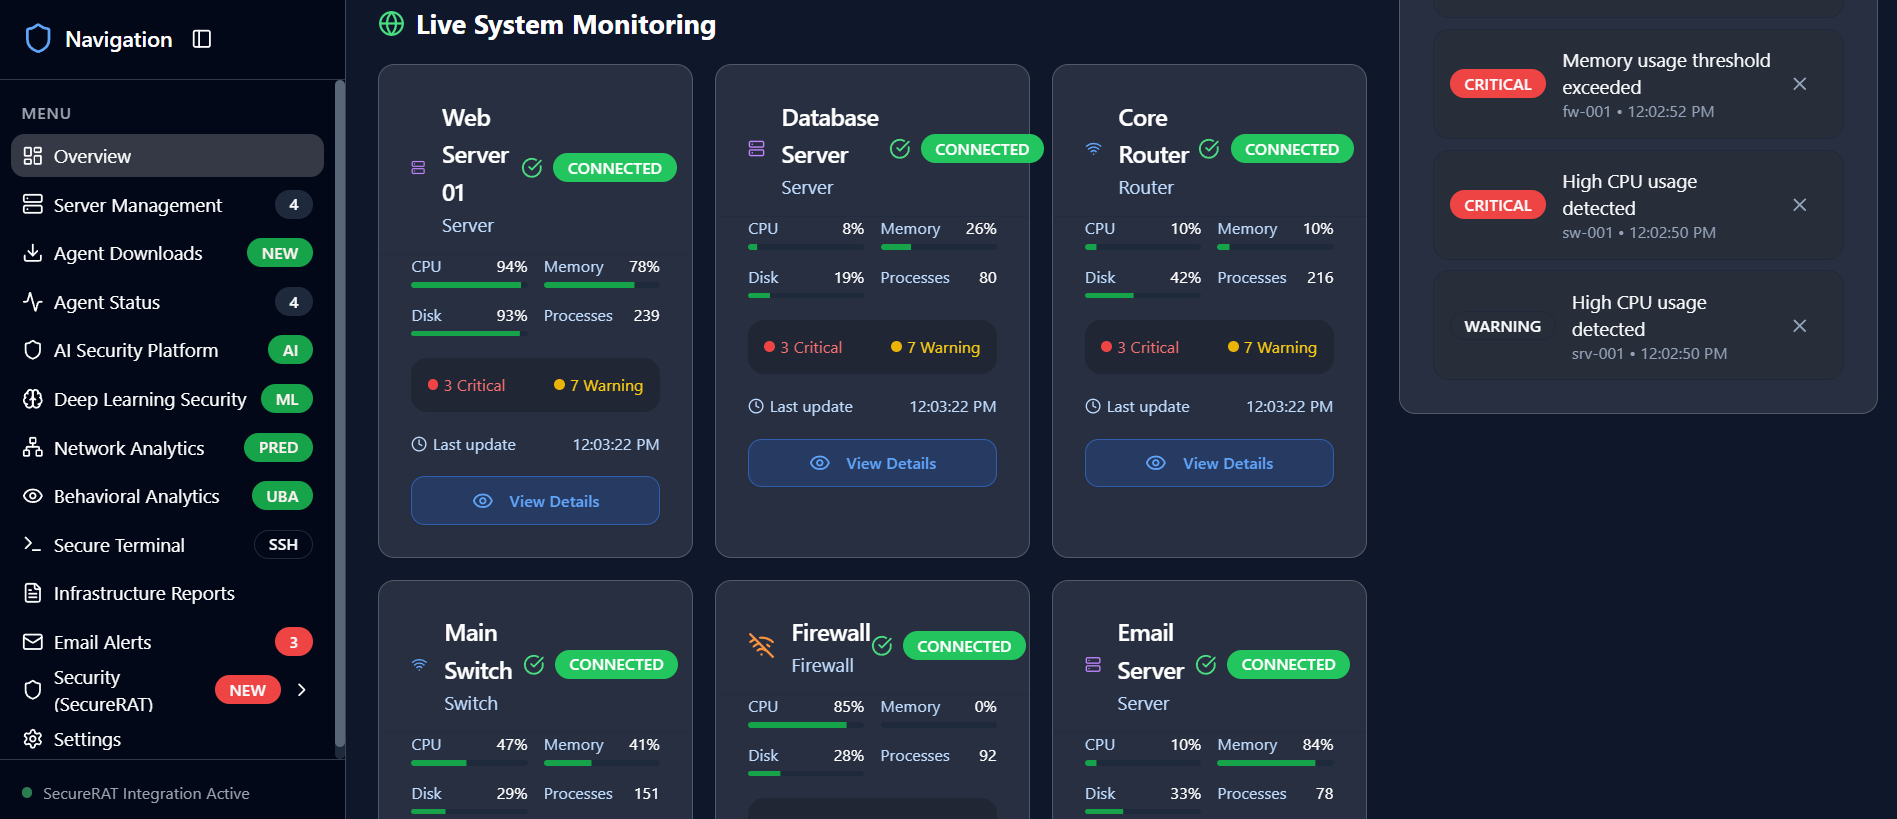
9. LIVE SYSTEM MONITORING
Real-time system monitoring with interactive controls:
MONITORING OVERVIEW:
• Total Systems count with dynamic updates
• Healthy Systems indicator (Green)
• Warning Systems indicator (Yellow)
• Critical Systems indicator (Red)
• System Uptime percentage display
INTERACTIVE ELEMENTS:
• VIEW DETAILS buttons (ENABLED) on each system card
• LAST HOUR SETTINGS button (ENABLED) for time-based monitoring
• Acknowledge All Alerts button for bulk operations
• Test Notifications button for system validation
SYSTEM CARDS:
• System name and type identification
• Connection status indicators
• Real-time metrics (CPU, Memory, Disk, Processes)
• Alert summary with Critical/Warning counts
• Last update timestamps
• Reconnect buttons for disconnected systems
MONITORING TABS:
• Overview tab with general system information
• Servers tab for server-specific monitoring
• Network tab for network device monitoring
• Applications tab for application performance
• Alerts tab for alert management
10. INTERACTIVE ELEMENTS SUMMARY
Complete list of enabled buttons and interactive features:
ENABLED BUTTONS:
' ADD DEVICE button (Secure Terminal sect ion)
' RUN FULL AUDIT button (Secur i ty Audi t Tests)
' GENERATE REPORTS button (Secur i ty Audi t Reports)
' VIEW DETAILS buttons (Live System Moni tor ing)
' LAST HOUR SETTINGS button (System Moni tor ing)
' Acknowledge Al l Alerts button (Overview)
' Test Not i f icat ions button (Overview)
' Generate Complete PDF Brochure button (Reports)
NAVIGATION ELEMENTS:
' Al l sidebar navigat ion buttons
' Tab swi tching controls
' Modal dialog controls
' Real-t ime moni tor ing toggles
SYSTEM INTERACTIONS:
' System status indicators
' Alert management controls
' Conf igurat ion form submissions
' Report generat ion and downloads
This comprehensive documentation covers all menus, buttons, and features
of the SecureRAT Enterprise Monitoring & Security Tool.
Document generated: 9/14/2025, 11:56:01 AM
Total pages: 7
Information
| Category | Scripts & Code / VB.NET |
| First Release | 14 September 2025 |
| Files included | .php, .html, .css, Javascript .js, .java, build.settings |
| Framework HTML/CSS | Bootstrap, Blueprint |
| Framework Javascript | jQuery, EXT JS, Backbone.js, Node.js |
| Software version | PHP 4.x, .NET 3.5 |
| File Size | 1 MB |
| Database version | MySQL 4.x |
| Frameworks | VB.NET |